
 Available in US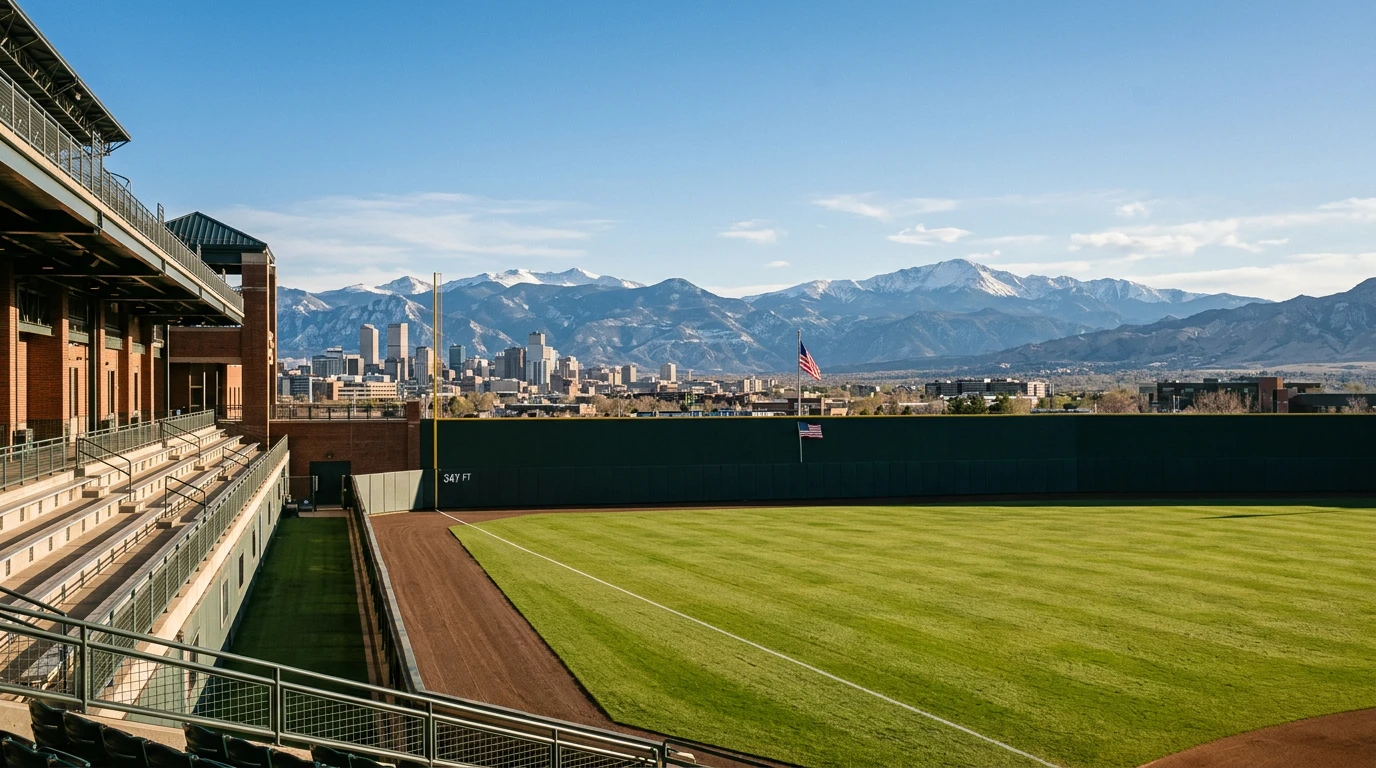
- The one MLB park I treat as a separate sport — Adjusting Run Totals for Coors Field Altitude Physics
- Why thin air changes the physics of the game
- The humidor: a partial fix that the market still misprices
- What the historical totals look like and where the value lives
- Why Rockies pitchers post road ERA gaps that look fake
- How I structure a Coors total bet without flinching
The one MLB park I treat as a separate sport — Adjusting Run Totals for Coors Field Altitude Physics
The first time I bet a Rockies home game, I lost my stake on a perfectly reasonable Under 9.5 in what looked like a great pitcher’s matchup on paper. The final score was 11-9. I learned a lesson that took five more attempts to fully internalise: Coors Field is not a baseball stadium. It is a wind tunnel at altitude that happens to host baseball games, and the totals market knows it.
Across nine years of MLB analysis, no single venue has cost me more on autopilot bets than Coors. The mistake every UK punter makes – myself included, repeatedly – is treating Coors like a regular launch pad with a slightly inflated total. It is not slightly inflated. It is structurally different. Pitchers’ breaking balls bend less, fly balls travel materially further, and the home team’s pitching staff develops splits so warped that their road numbers look like they belong to different humans.
Get the Coors mental model right and you have an angle that pays for itself across a long season. Get it wrong and the totals market in Denver will feed on your bankroll all summer.
Why thin air changes the physics of the game
Coors Field sits at 1,580 metres above sea level – over 5,200 feet – making it by some distance the highest park in MLB. That altitude reduces air density by roughly 17% compared to a sea-level stadium. Less air to push through means less drag on the baseball, which means more carry on every fly ball.
The number that matters: at Coors, a baseball flies about 5% further than the same struck ball at sea level, which works out to roughly 15 to 20 extra feet on a long fly. That is the difference between a routine warning-track out and a souvenir. Marginal contact that dies at the wall in San Francisco clears the fence in Denver. Compounding the issue, breaking pitches lose grip on the air the same way the batted ball does. A curveball that snaps eight inches in Cleveland breaks five inches in Denver. Hitters see flatter sliders and softer curves, both of which they punish.
The third effect is less obvious but matters for live betting. Outfielders take longer routes on fly balls because the ball carries beyond their first read. You see more doubles and triples on balls hit into the gap, and more singles falling in front of charging fielders who hesitated. The on-paper park factor for hits sits roughly 12% above league average. The park factor for runs has run between 115 and 125 across the last three seasons.
The humidor: a partial fix that the market still misprices
The Rockies installed a humidor in 2002 to soak baseballs to 50% relative humidity before games, which makes the leather slightly heavier and softer. The idea was to undo some of the altitude advantage. It worked, partly. Run scoring at Coors fell from its mid-1990s madness – the era of 13-run averages – to merely the highest rate in baseball.
MLB then introduced a universal humidor across all 30 parks before the 2022 season. That changed the mental model again. The Coors-specific humidor edge is no longer unique because every park stores balls at controlled humidity now. What did not change: Denver’s altitude. The humidor compresses the gap between Coors and the rest of the league, but the gap is still enormous because the air itself doesn’t care what humidity the ball was stored at. Once the ball leaves the bat, altitude takes over.
The trap for UK punters who half-read the humidor story: they assume Coors has been “fixed” and the totals are now reasonable. They are not reasonable. They are merely less insane than 1996. A line of 11 at Coors is normal. The same matchup in Cleveland gets a 7.5. The market knows this and prices it in. Your edge is not in spotting that Coors is high – everyone knows. Your edge is in the second-order effects.
What the historical totals look like and where the value lives
Across the last three seasons, Coors home games have averaged a closing total around 11.0, with totals ranging from 9.5 in extreme pitcher-friendly weather to 13.5 in the August heat. The actual scoring has averaged about 11.6 runs per game across that sample. That 0.6-run gap is small but consistent – overs grade out marginally ahead, with most of the edge concentrated in specific weather windows.
The two windows I care about. First: hot, dry afternoon games in July and August, when the ball density study supports a measurable home run uptick. The Dartmouth climate research found each 1°C increase in temperature lifts home run probability by 1.96% per game, which compounds at altitude. Second: night games following a hot afternoon, when the air is still warm and humidity tends to drop into the teens. Both setups push overs into territory the closing line undersells.
The opposite spot is also worth knowing. Cool, damp Coors evenings – 12 to 14 degrees, light rain in the forecast – are the underrated under spots in baseball. The cold air is denser than altitude can fully offset, and the wet ball spins less. Local Denver weather can flip a “Coors over” into a defensible under inside two hours. I check the park’s pre-game weather feed at the four-hour, two-hour and 30-minute marks before any total bet at altitude. A wider tour of MLB hitter and pitcher parks puts Denver in proper context – every other launch pad is an asterisk by comparison.
Why Rockies pitchers post road ERA gaps that look fake
If you want a working illustration of the Coors effect, look at the home/road ERA splits of any Colorado starter who has stuck around long enough. Most modern Rockies starters carry a home ERA more than a full run higher than their road ERA, often closer to 1.5 runs higher across a full season. That is not random. It is the same pitcher throwing the same pitches into different physics.
The flip side is the recovery effect. Rockies pitchers leaving Coors for a road start often look better than their season ERA suggests in early innings, because their breaking balls suddenly bite the way they were taught they should. Pitchers acquired from Colorado in trades show a similar pattern: their first month with a new team often produces ERAs a run below their Rockies baseline. The market is slow to adjust because the eyeball numbers – career ERA, season WHIP – anchor expectations.
For UK punters this means two things. Don’t price a Rockies home pitcher by season ERA – use his Coors-only splits. And don’t fade a Rockies pitcher in his first start at sea level just because his career ERA is ugly. The 2025 NL ERA leader Paul Skenes ran a 1.97 mark for Pittsburgh – a fair benchmark for what a quality NL arm looks like in a neutral environment. A solid Rockies arm, dropped into Pittsburgh’s PNC Park, can produce ERAs that look much closer to that benchmark than his Coors numbers would predict.
How I structure a Coors total bet without flinching
The discipline rule that took me three seasons to land on: I never bet a Coors total without three independent reasons for the lean. One reason is not enough at altitude. The variance is too wide.
For an over, my checklist is weather, lineup, pitching matchup. Weather means temperature above 22 degrees and a wind component blowing out, even mildly. Lineup means both teams in the top 12 for runs per game over the trailing 30 days. Pitching matchup means at least one starter with a season ERA above 4.50 or a recent stretch of poor command. Three out of three and I take the over at the closing number even if it sits at 12. Two out of three and I pass. One out of three is a no-bet regardless of price.
For an under at Coors, I want all four factors aligned: temperature below 16 degrees or rain in the forecast, both starters with sub-3.50 season ERAs and good command splits, both lineups in the bottom half of the league for OBP, and the wind blowing in. That four-factor confluence is rare – maybe 10 to 15 home games a season qualify – but the under hit rate in those spots over the last three years has been comfortably above break-even. The discipline is in passing on the 60 other Coors games where the picture is less clean.
The market has tightened these spots over the last two seasons as more punters use weather data. The edges are thinner than they were. They are still there if you wait for the four-factor games and ignore everything in between.
Articles
Published by the tipsbettingb team.
